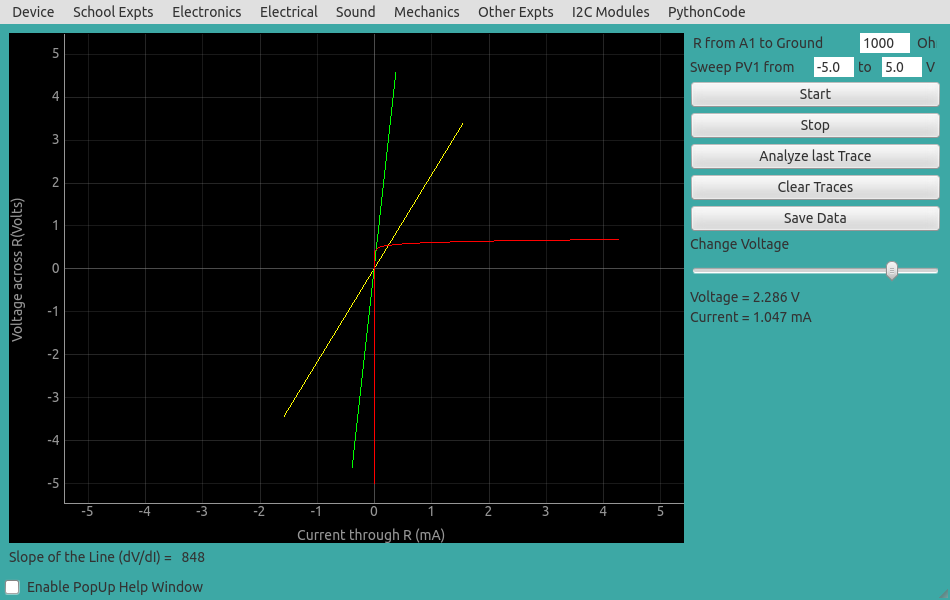
Two resistances are connected as shown in the diagram. R2 (generally 1k) is used for measuring the current indirectly, ie from the voltage drop across it. The voltage at PV1 can be set using a slider. The displayed voltage is the voltage across R1. The current also will be displayed. The voltage can be varied within selected values and IV plots can be generated.