
|
|
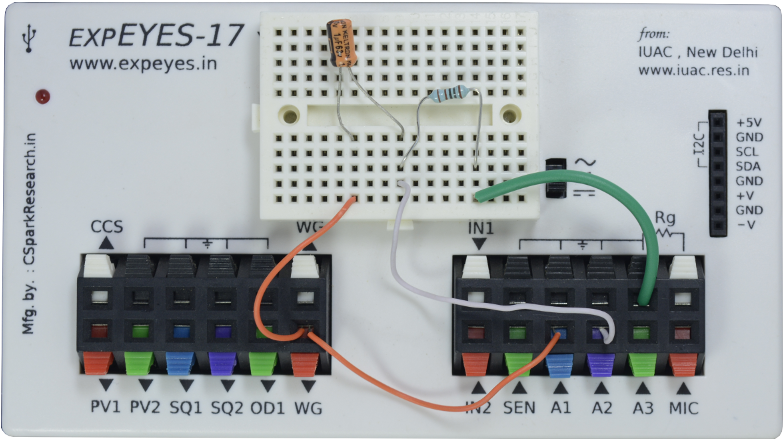
| Wiring Diagram | Photograph of the experimental setup. |
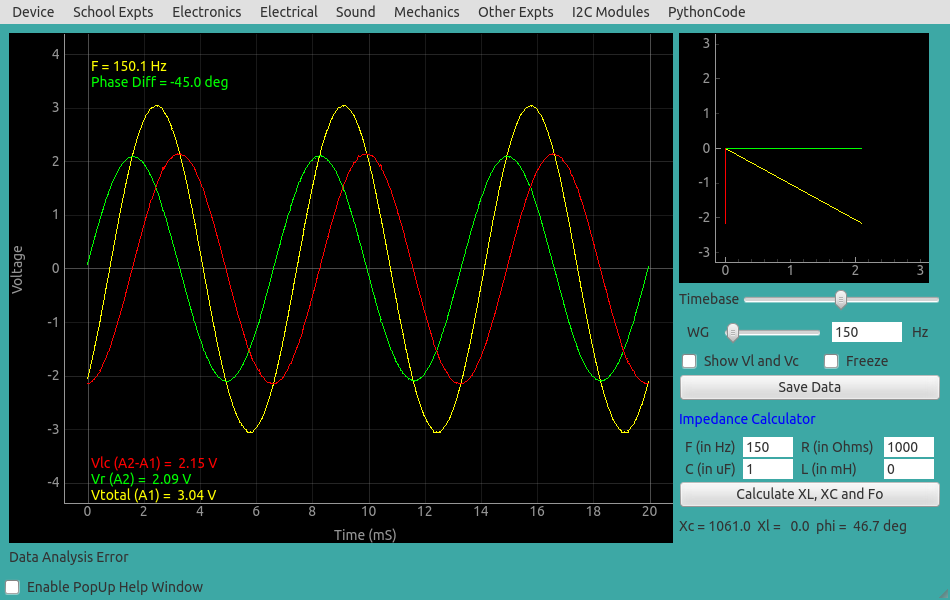 |
| Screen shot of the voltages in series RC circuit |
 |
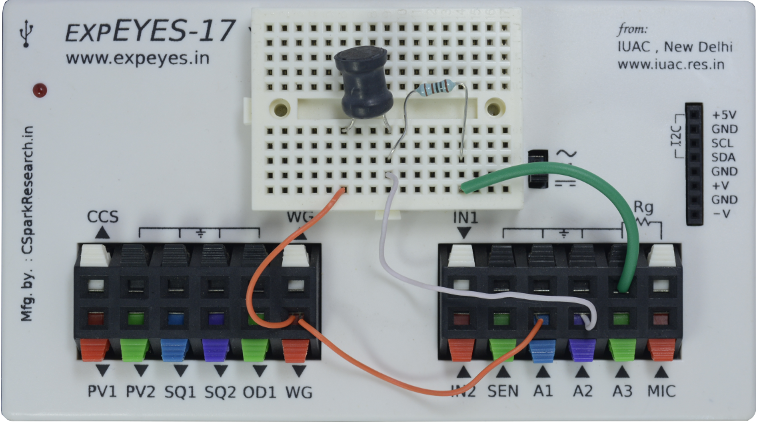 |
| Wiring Diagram | Photograph of the experimental setup. |
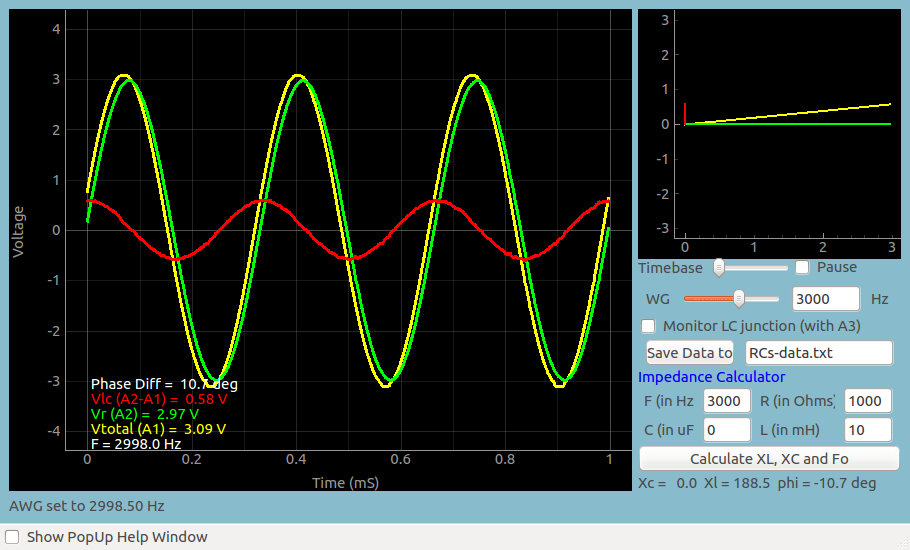 |
| Screen shot of the voltages in series RC circuit |
 |
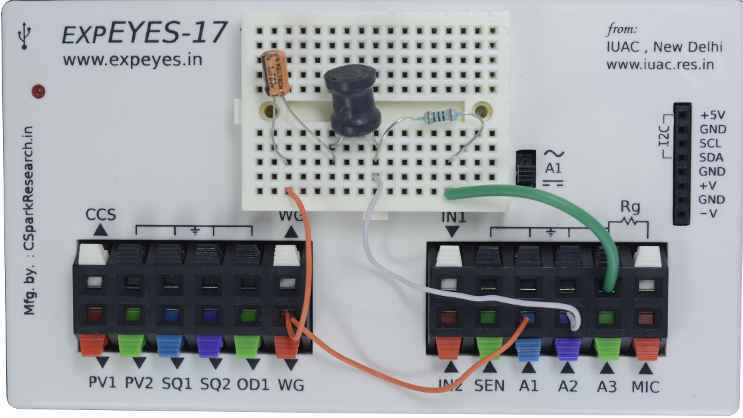 |
| Wiring Diagram | Photograph of the experimental setup. |
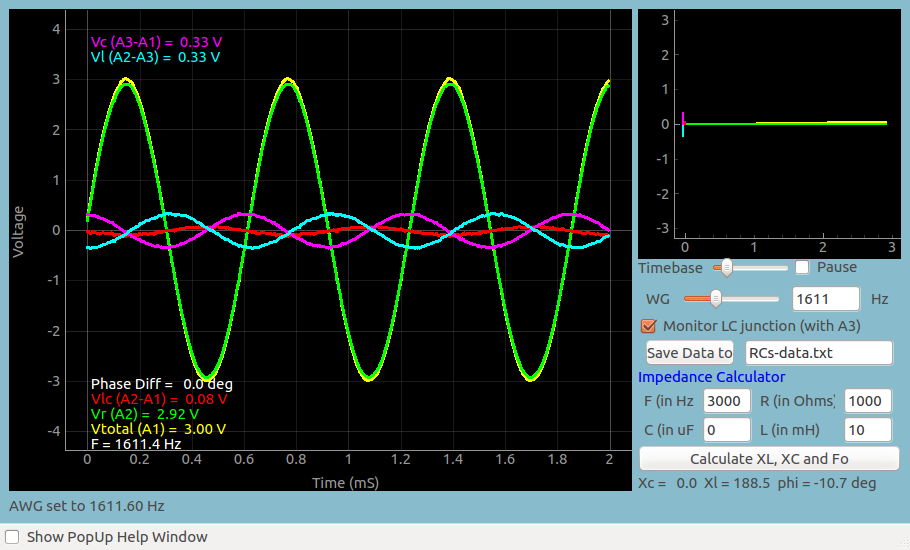 |
| Screen shot of the voltages in series RLC circuit, at resonance. |